Media
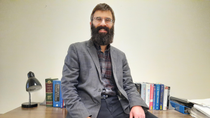
Keith Task: Leveraging data science in experiments

A former Boy Scout, Keith has always been interested in the outdoors, nature, and community work. After completing his bachelor’s degree in chemical engineering at the University of Pittsburgh, he joined the Peace Corps and spent two years in Uganda helping support local HIV health networks, promoting education and advocacy, and teaching IT to locals.
He returned, and in 2014 finished his Ph.D. in Chemical Engineering, also at the University of Pittsburgh. He joined BASF in 2015 working in various positions, but always involved with data analytics. Today, he is a Principal Scientist, working from the Beachwood site, in Ohio.
What led you to choose chemical engineering as your career path?
I always enjoyed math, and I like chemistry, so merging them into chemical engineering seemed like the right fit. I have always been interested in working with numbers, the type of approach has just changed over the years. In high school, you take algebra, trigonometry and calculus, and that was part of what led me to engineering.
My high school physics teacher was a chemical engineer. I was speaking with him about it, and seemed like something I would enjoy, which is another reason I chose this educational path. During my chemical engineering graduate program, my research included both experimental and computational work. While I enjoyed both, I eventually chose to focus on computational approaches in my career.
I liked doing research for industry purposes, so I wanted to stick with it. I wasn't set on the chemical industry, but as a chemical engineer, of course, it was extremely interesting for me. I'm very happy I ended up at BASF. I'm comfortable speaking chemistry and it’s still very interesting to me all these years later.
What is your current position at BASF?
My main responsibility is to help my colleagues and partners in BASF, mainly in the research and development (R&D) area, make sense of their data. I help my colleagues plan their experiments and make them more efficient, and when they collect the experimental data, I help them use it so they can make better decisions and optimize the properties of their materials or optimize their processes.
In a nutshell, my main focus is to apply data-driven approaches, statistics, machine learning and techniques of the sort to help their R&D be more efficient in order to make discoveries.
I work with a wide range of colleagues from different units. However, the best working relationship and the best results come from true partnership. I get to know their data as much as I can, I know their processes, their materials, how the experiments work, and we really go back and forth. And it's not as simple as them sharing the data and me providing a result. We discuss what happened in the experiment, what is the data, and what the chemistry is all about. Then I work with them in order to determine what they need.
I'm also a part of the global data analytics for R&D group, and we have regular meetings and interactions with people in Germany and in China. In addition to that, we also have a digitalization group for R&D in North America, that interacts with different sites across the United States. Some of that involves the data analytics side of things, and some are more linked to quantum chemistry and molecular modeling. This is great because in the region there are different competencies, there are different capabilities. We speak often, and we exchange methods.
I’m also the global scientific discipline lead in data analytics for physics, and its primary focus is to bring people together to advance a certain area of science, in this case, the link between data-driven approaches and the natural sciences.
What this discipline tries to do is extract information from the data-driven approaches that relates to biology, chemistry, and physics, as well as integrate domain knowledge into our data-driven approaches. Because I'm leading this effort, I help coordinate approaches, meetings and different projects in this area.
The best working relationship and the best results come from true partnership.
Can you provide an example of a data-driven project?
Sure, I worked on a project in the polyurethane foam area. Polyurethane is very ubiquitous; it’s everywhere, and it’s a very important product for BASF. We have specific data about how to formulate polyurethane foams: what are the ingredients, the properties, etc. Properties are especially important, for instance the density of the foam, or its airflow. We had this data and wanted to use it for predictive purposes.
The project was focused on building a data-driven model, a predictive model based on this information. The first step was to do data structuring, management and data architecture, and pre-processing. What we then did was to apply data analytics techniques, such as machine learning: taking the data and building a model that allowed us to predict the properties of the foam (density, hardness, airflow, etc.), based on the formulation.
So now, if we have a formulation or a potential formulation, even before running the experiment, we could put those ingredients into the model so it predicts what the polyurethane foam would look like based on the model. This can help guide the experimentalists and prioritize formulations.
It’s not replacing experiments, but it helps. It supplements their work so they can do things faster, and screen different formulations before making them.
In addition to predicting foam properties from the formulation, we can also predict what formulation components and amounts are needed to achieve target properties. This is inverse modeling through mathematical optimization.
Finally, we embedded these digital tools into a web-based interface, or app, so that our colleagues don't have to come to us every time they want a prediction or every time they need a guide.
They have this web-based app and can place their parameters into it and get the associated predictions, thereby guiding their experiments.
What do you enjoy most about your work?
A very rewarding aspect of my job is teaching. The trainings and seminars I conduct within BASF are focused mainly on introductory statistics and visualization, or on experimental design. If there is a lab, a colleague or a scientist who is interested in learning more or gaining more knowledge of these techniques and wants to use them more in their lab, we work together on a course which fits their needs.
My seminars take approximately a day and are mostly done in person, with about 20 or 25 people. I work with them to try to integrate their problems and their examples into the training. It’s hands-on, so they have the software and work on real-life examples during the course. The goal is, by the end of the day, they understand why the techniques are useful and how to apply them successfully.
Another thing I enjoy is working on new methods. It’s all about seeing what's out there, reading academic papers and learning about new techniques we don't have in-house and could be beneficial for BASF. Being on top of innovative technology in the data analytics area is quite exciting.
Finally, a really exciting part for me is working with data analytics using chemical data for chemical and material development and having the opportunity to link different modeling paradigms. In data analytics, the main modeling paradigm is data-driven, finding correlations in the information. But there are other paradigms that people have been working on for centuries, theory, equations, etc. In my role, in particular, I get to bring together these approaches.
For questions, please contact mariana.licio@basf.com.
For media inquiries, please contact molly.birman@basf.com.
