Factbook

At a Glance

At BASF, we create chemistry for a sustainable future. We combine economic success with environmental protection and social responsibility. Around 111,500 employees contribute to the BASF Group’s success worldwide. Our business is divided into the Chemicals, Materials, Industrial Solutions, Surface Technologies, Nutrition & Care and Agricultural Solutions segments.

Verbund concept

applied to production, technologies, market, digitalization


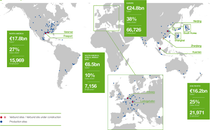
With companies in 91 countries

we contribute to our customers’ success


Broad portfolio

6 segments, 11 operating divisions, 71 strategic business units


Organizational structure

for customer proximity, competitiveness and profitable growth

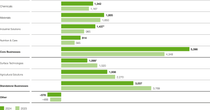
sales-by-segment.png

Million € 2018 2019 2020 2021 2022
Sales 60,2201 59,316 59,149 78,598 87,327
Income from operations before depreciation, amortization and special items 9,2711 8,3242 7,435 11,348 10,762
Income from operations before depreciation and amortization (EBITDA) 8,9701 8,1852 6,494 11,355 10,748
Income from operations (EBIT) before special items 6,2811 4,6432 3,560 7,768 6,878
Income from operations (EBIT) 5,9741 4,2012 –191 7,677 6,548
Net income 4,707 8,421 –1,060 5,523 –627
Return on capital employed (ROCE) (%) 12.01 7.7 1.7 13.73 10.0
Earnings per share (EPS) (€) 5.12 9.17 –1.15 6.01 –0.70
Adjusted earnings per share (EPS) (€) 5.87 4.00 3.21 6.76 6.96
Dividend per share (€) 3.20 3.30 3.30 3.40 3.40
Dividend yield4 (%) 5.30 4.90 5.10 5.50 7.33
Cash flows from operating activities 7,939 7,474 5,413 7,245 7,709
Free cash flow 4,045 3,650 2,284 3,713 3,333

1 Figures for 2018 were restated with the presentation of the construction chemicals activities as discontinued operations.

2 Figures for 2019 were restated to reflect the reclassification of income from non-integral companies accounted for using the equity method to net income from shareholdings.

3 The polyolefins and styrenics businesses of the joint venture BASF-YPC Company Ltd., Nanjing, China, which were previously reported under Other, were allocated to the Petrochemicals division as of January 1, 2022. The figure has been adjusted accordingly. Overall, the adjustments improved the BASF Group’s ROCE for 2021 by 0.2 percentage points to 13.7%. For more information, see basf.com/q12022.

4 Based on year-end share price

Last Update May 26, 2023