Factbook
Regional Results
Sales by location of company
| Million € | 2015 | 2016 | 20171 | 20182 | 2019 | 2020 | 2021 | 2022 | 2023 | 2024 |
| Europe | 38,675 | 27,221 | 28,045 | 27,526 | 25,706 | 24,223 | 31,594 | 35,821 | 27,631 | 26,169 |
| North America | 15,665 | 14,682 | 15,937 | 15,900 | 16,420 | 16,440 | 21,935 | 24,343 | 19,003 | 18,168 |
| Asia Pacific | 11,712 | 11,512 | 13,658 | 13,454 | 13,384 | 14,895 | 20,632 | 21,309 | 17,142 | 15,886 |
| South America, Africa, Middle East | 4,397 | 4,135 | 3,583 | 3,340 | 3,806 | 3,591 | 4,437 | 5,854 | 5,126 | 5,037 |
| BASF Group | 70,449 | 57,550 | 61,223 | 60,220 | 59,316 | 59,149 | 78,598 | 87,327 | 68,902 | 65,260 |
Sales by location of company 2024

Sales by location of customer
| Million € | 2015 | 2016 | 20171 | 20182 | 2019 | 2020 | 2021 | 2022 | 2023 | 2024 |
| Europe | 36,897 | 26,039 | 26,507 | 25,589 | 23,827 | 23,129 | 30,531 | 33,922 | 26,022 | 24,778 |
| North America | 15,390 | 14,042 | 15,357 | 15,388 | 15,948 | 15,709 | 20,867 | 23,869 | 18,833 | 17,773 |
| Asia Pacific | 12,334 | 12,165 | 14,343 | 14,210 | 14,203 | 15,406 | 21,234 | 21,823 | 17,520 | 16,226 |
| South America, Africa, Middle East | 5,828 | 5,304 | 5,016 | 5,033 | 5,338 | 4,905 | 5,965 | 7,713 | 6,527 | 6,482 |
| BASF Group | 70,449 | 57,550 | 61,223 | 60,220 | 59,316 | 59,149 | 78,598 | 87,327 | 68,902 | 65,260 |
Sales by location of customer 2024

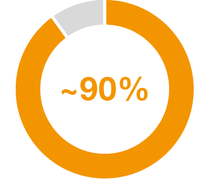
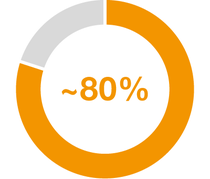
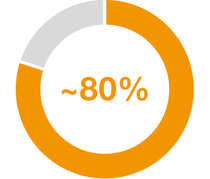
Share of sales from locally manufactured products in 2024
Europe

North America

Asia Pacific3

South America, Africa, Middle East

1 Figures for 2017 were restated with the presentation of the oil and gas activities as discontinued operations.
2 Figures for 2018 were restated with the presentation of the construction chemicals activities as discontinued operations.
3 Including BASF-YPC Company Ltd., which operates the Verbund site in Nanjing, China
