Factbook
Industrial Solutions
The Industrial Solutions segment consists of the Dispersions & Resins and the Performance Chemicals divisions. It develops and markets ingredients and additives for industrial applications, such as polymer dispersions, resins, electronic materials and antioxidants. We aim to grow organically in key industries such as automotive, plastics, paints and coatings, electronics, and energy and resources. We want to expand our position by leveraging our comprehensive industry expertise and application know-how.
Divisions

A new material for electric mobility
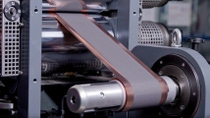
With its new Licity® anode binder product range for lithium-ion battery manufacture, BASF is paving the way for electric mobility. Licity® anode binders are materials that improve battery performance, enabling a higher capacity, an increased number of charge and discharge cycles and reduced charging times. This is a new binder technology that pushes the capabilities of lithium-ion batteries, thus supporting the wider adoption of electric vehicles. BASF aims to achieve net sales of more than €30 million in 2027 with this product.
For more information on Licity®, see basf.com/licity


