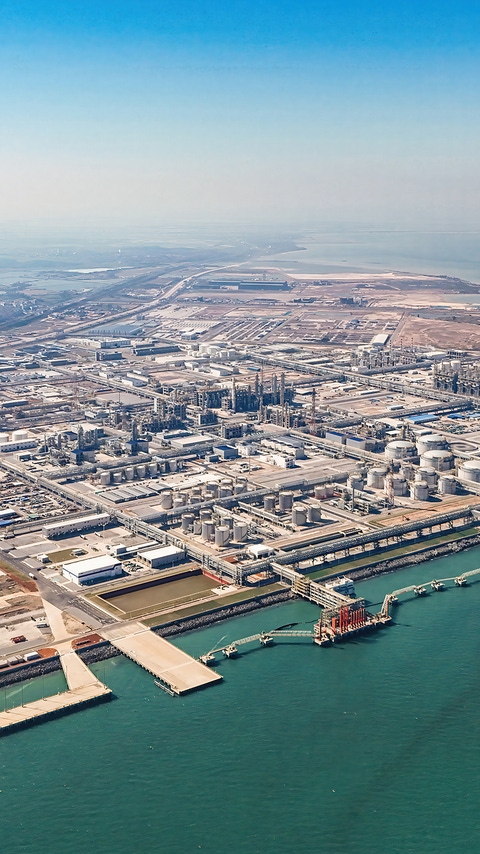
With the Verbund site in Zhanjiang, BASF is strengthening its presence in the Chinese market. The site is a highly integrated, efficient and sustainable production facility that is powered entirely by renewable electricity. It offers a broad portfolio to key industrial sectors in China.

Factbook

Chemicals

The Chemicals segment comprises the Petrochemicals and Intermediates divisions. It contributes to our direct customer business and supplies the other segments with basic chemicals and intermediates, contributing to the organic growth of our key value chains. Customers in this segment mainly come from the chemical and plastics industries. We aim to further strengthen our competitiveness through technological leadership, operational excellence and products with a lower carbon footprint.

Divisions

Petrochemicals
Broad portfolio of high-quality basic chemicals and specialties, tailored to the needs of internal and external customers, which serve as starting materials for products such as dispersions, paints, coatings, plastics, insulating materials and hygiene products
Intermediates
Comprehensive portfolio of commodities and specialties, which are used as precursors for products such as coatings, plastics, textile fibers, pharmaceuticals and crop protection products

Sales 2025

Sales by division

Sales by region

By location of customer

Diagram: Sales by division - Chemicals
Diagram: Sales by region - Chemicals

Factors influencing sales

EBITDA before special items

Diagram: Factors influencing sales - Chemicals
Diagram: EBITDA before special items - Chemicals

Segment data Chemicals

Million € 2025 2024 2023 2022 2021
Sales to third parties 10,055 10,838 10,369 14,895 13,579
Share of total BASF sales (%) 16.9 17.6 15.0 17.1 17.3

of which Petrochemicals

7,492 8,050 7,418 10,546 9,674

      Intermediates

2,564 2,788 2,951 4,349 3,904
EBITDA before special items 853 1,342 1,167 2,774 3,842
EBITDA margin before special items (%) 8.5 12.4 11.3 18.6 28.3
EBITDA 747 1,314 1,167 2,771 3,882
EBITDA margin (%) 7.4 12.1 11.3 18.6 28.6
Income from operations (EBIT) before special items –88 503 361 1,956 3,092
Income from operations (EBIT) –374 429 364 1,758 3,115
Segment cash flow –1,182 –2,051 –936 1,878
Last UpdateMay 28, 2026