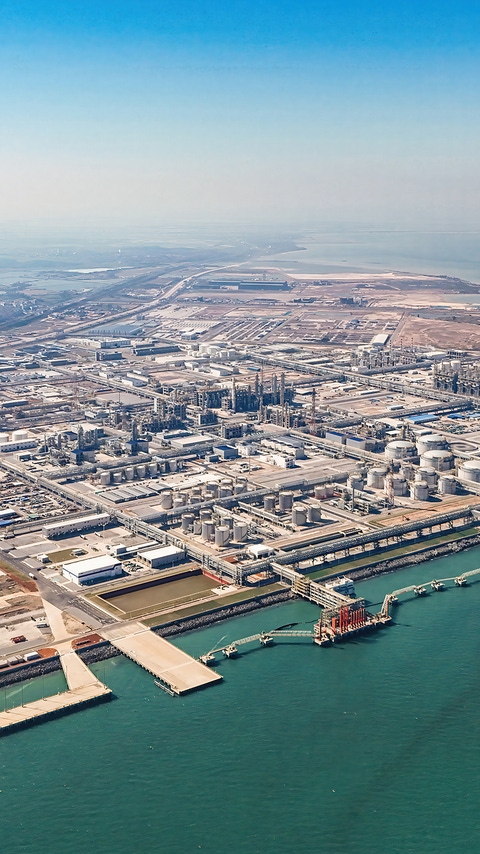
With the Verbund site in Zhanjiang, BASF is strengthening its presence in the Chinese market. The site is a highly integrated, efficient and sustainable production facility that is powered entirely by renewable electricity. It offers a broad portfolio to key industrial sectors in China.

Factbook

Materials

The Materials segment comprises the Performance Materials and the Monomers divisions. Together, these divisions have one of the world’s largest production capacities for highperformance plastics and precursors for processing industries. With its broad portfolio of large-volume monomers and basic polymers along the isocyanate and polyamide value chains, the Monomers division follows a lean and costoptimized approach. The Performance Materials division offers innovative and customized solutions in engineering plastics, polyurethanes, thermoplastic polyurethanes and specialty plastics. Close cooperation with customers, especially with regard to sustainable product developments, generates additional value.

Divisions

Performance Materials
Polyurethanes, thermoplastic polyurethanes, engineering plastics and specialty plastics for sectors such as automotive, construction, consumer goods as well as industrial applications
Monomers
Isocyanates and polyamides as well as inorganic basic products and specialties for various sectors, including plastics, automotive and construction

Sales 2025

Sales by division

Sales by region

By location of customer

Diagram: Sales by division - Materials
Diagram: Sales by region - Materials

Factors influencing sales

EBITDA before special items

Diagram: Factors influencing sales
Diagram: EBITDA before special items

Segment data Materials

Million € 2025 2024 2023 2022 2021
Sales to third parties 12,742 13,510 14,149 18,443 15,214
Share of total BASF sales (%) 21.4 22.0 20.5 21.1 19.4

of which Performance Materials

6,425 6,848 7,244 8,567 7,292

      Monomers

6,316 6,661 6,905 9,877 7,922
EBITDA before special items 1,575 1,805 1,650 2,686 3,208
EBITDA margin before special items (%) 12.4 13.4 11.7 14.6 21.1
EBITDA 1,502 1,769 1,523 2,660 3,162
EBITDA margin (%) 11.8 13.1 10.8 14.4 20.8
Income from operations (EBIT) before special items 722 987 826 1,840 2,418
Income from operations (EBIT) 635 939 378 1,776 2,345
Segment cash flow 1,054 766 1,369 2,363
Last UpdateMay 28, 2026