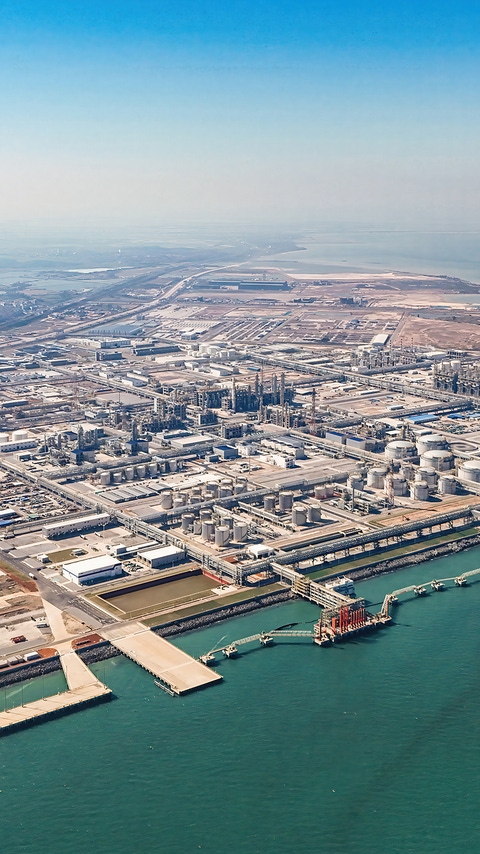
With the Verbund site in Zhanjiang, BASF is strengthening its presence in the Chinese market. The site is a highly integrated, efficient and sustainable production facility that is powered entirely by renewable electricity. It offers a broad portfolio to key industrial sectors in China.

Factbook

Nutrition & Care

The Nutrition & Care segment consists of the Care Chemicals and the Nutrition & Health divisions. It serves the growing demands of food and feed producers and of the pharmaceutical, cosmetics, detergent and cleaner industries. We leverage the BASF Verbund to offer innovative products, combining performance with beneficial sustainability profiles. We strive to expand our position as a leading provider of essential ingredients in the areas of nutrition, home and personal care, as well as for technical applications, mainly through organic growth based on global production capacities. We are focused on markets with long-term growth potential.

Divisions

Care Chemicals
Ingredients for the cosmetics, detergents and cleaning industries, agrochemical and technical applications
Nutrition & Health
Products for the food and feed, flavor and fragrance as well as pharmaceutical industries

Sales 2025

Sales by division

Sales by region

By location of customer

Diagram: Sales by division - Nutrition & Care
Diagram: Sales by region - Nutrition & Care

Factors influencing sales

EBITDA before special items

Diagram: Factors influencing sales - Nutrition & Care
Diagram: EBITDA before special items - Nutrition & Care

Segment data Nutrition & Care

Million € 2025 2024 2023 2022 2021
Sales to third parties 6,509 6,729 6,858 8,066 6,442
Share of total BASF sales (%) 10.9 11.0 10.0 9.2 8.2

of which Care Chemicals

4,765 4,751 4,721 5,619 4,439

      Nutrition & Health

1,744 1,978 2,137 2,447 2,003
EBITDA before special items 649 814 565 1,067 909
EBITDA margin before special items (%) 10.0 12.1 8.2 13.2 14.1
EBITDA 630 819 578 1,055 967
EBITDA margin (%) 9.7 12.2 8.4 13.1 15.0
Income from operations (EBIT) before special items 133 273 107 618 497
Income from operations (EBIT) 76 220 119 605 554
Segment cash flow –67 -31 503 –99
Last UpdateMay 28, 2026